At one time, I identified myself as a field geologist by vocation if not necessarily by aptitude. Many field geologists have a collateral hobby to augment the experience and/or relieve the mind from the constant focus on rocks. For my old boss in the Canadian bush, George Erdosh, it was edible mushrooms. Many field days ended in a hunt for elm caps or morels. For me, it is wild birds. This post is dedicated to the birds.
“The canary in the coal mine” is a well known, and perhaps over-used metaphor for an early warning indicator of impending negative societal and economic events. It’s origin is, of course, authentic arising from the use of canaries in underground coal mines to warn miners of the presence of deadly carbon monoxide gas. Birds require the intake of larger amounts of air relative to body mass than large mammals to support their flying habit, so are affected earlier than humans by any degradation in air quality. As late as 1986, miners carried their canaries in cages or special boxes with oxygen canisters that could be opened to revive an asphyxiated bird. One’s survival depended on paying attention to the health of the canary on duty at the workplace.
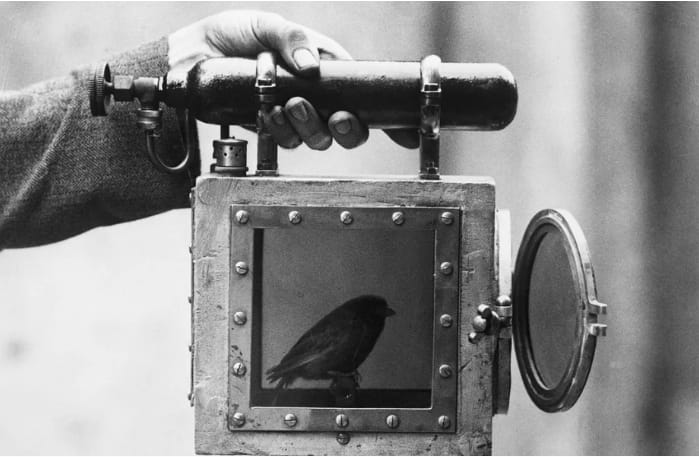
Source: Smithsonian Magazine, Getty images
Are the birds telling us something today?
We have been more, or less, continuously observing waterfowl and feeding songbirds at our home office on Lake Coeur d’Alene since moving here full-time in 2017. Beginning in 2022, and intensifying in 2023, we noticed a decline, particularly, in feeder bird numbers and species. This we attributed to drought. In 2024, only half our nest boxes were occupied, notably absent the former quantity of swallows and chickadee nests. Abruptly, around August 15, 2024, birds vanished from our feeders for all intents and purposes. We only saw the occasional hummingbird or seed-eater. I didn’t refill our seed feeders from mid-August to mid-October when I finally took them down to dump the remaining seed, clean them, and refill them with a very small amount of new feed. This situation continued through the winter and into the beginning of the migration this Spring. As of the date of this post, the zero bird status continues except for some fairly steady business from platform-feeding quail, the odd towhee or sparrow. Most of the neighbors that I polled in the surrounding area reported similar findings, although most people I know in Coeur d’Alene didn’t notice anything. The local Audubon club offered little confirmation except for a concern expressed about eagle populations.
The really big drop seems to be in the various finches and siskins, but there are fewer thrushes, owls, kinglets, wrens, warblers, and grouse, among others.
Birdcast’s Migration Dashboard is an interesting tool that shows all kinds of data about each year’s migration by U.S. state or county. Weather radar data is interpreted to distinguish biological from precipitation reflections, allowing estimates of local nightly migration numbers. Other types of data are integrated to give predictions of the actual species present in the flights. The number of birds is posted for each night and a graph is provided to show the arrivals on each night in the range March 15 to June 15 for any single year back to 2021. More interesting, an historical average cumulative total graph comprising the mean count for each day of the period 2013 – 2021 is also posted for reference. The example below is for Kootenai County, ID, April 5, 2025
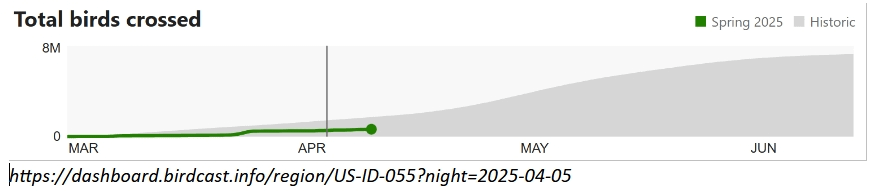
h ttps://dashboard.birdcast.info/region/US-ID-055?night=2025-04-05
You can hover over any point along the scale to get the exact cumulative count for the year/month/night of interest. Unfortunately, the shaded historical cumulative graph is not live, nor is the scale very convenient, but approximate counts can be obtained by manual scaling on a computer screen, which I have done. Data for my location is shown in the table below (Updated to May 5, 2025).
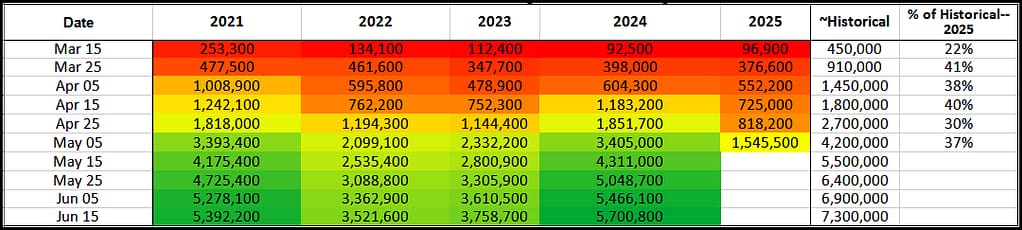
Trends for these four years and developing 2025 show a couple of interesting features. First of all, 2022 and 2023 were down years compared to 2021 and historical data. A rebound was seen 2024. The row with June 15 cumulative birds is most significant because the migration peak dates vary each year according to the progression of favorable climate conditions. Cumulative migration totals by June 15 were below 80% of the historical average in every year with the 2022 – 2023 period showing levels of ~50% of historical average. Based on 2025 results-to-date, it’s shaping up as a slow start for this season, much like 2022 and 2023.
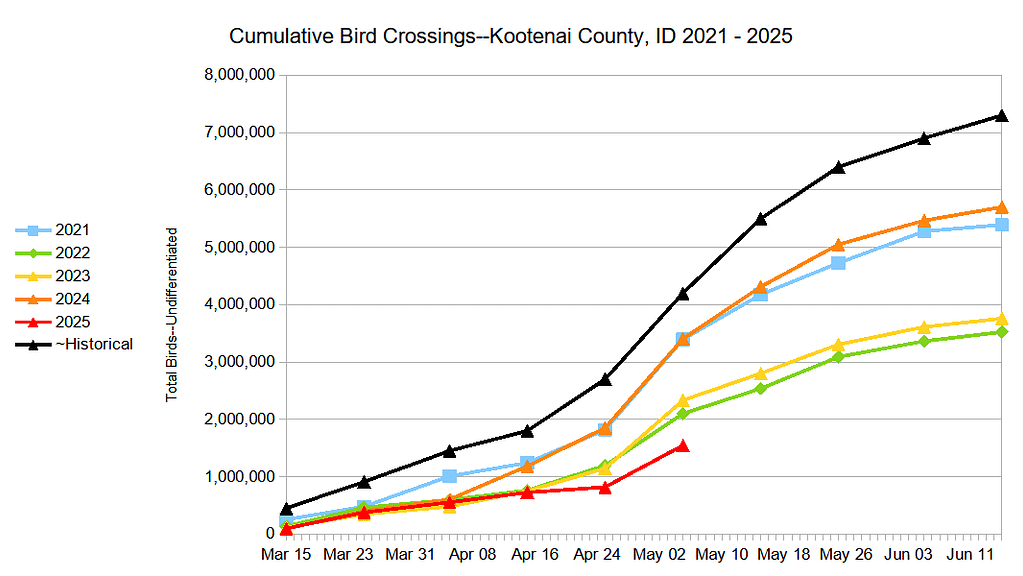
The findings can be further visualized with the line chart below (updated to May 5, 2025):
The question that the reader might ask is if Kootenai County is in any way representative of the U.S. as a whole? The first check on that was to compile the data for Shasta County (Redding) which is located along the Sacramento River flyway where I have done a bit of birdwatching in the last two years. The migration there involves approximately 5 – 10x the number of birds I see at home. Sadly, corroborated by my trip there around April 1st, Redding’s migration is also sub-par for every year shown (updated to May 5, 2025):
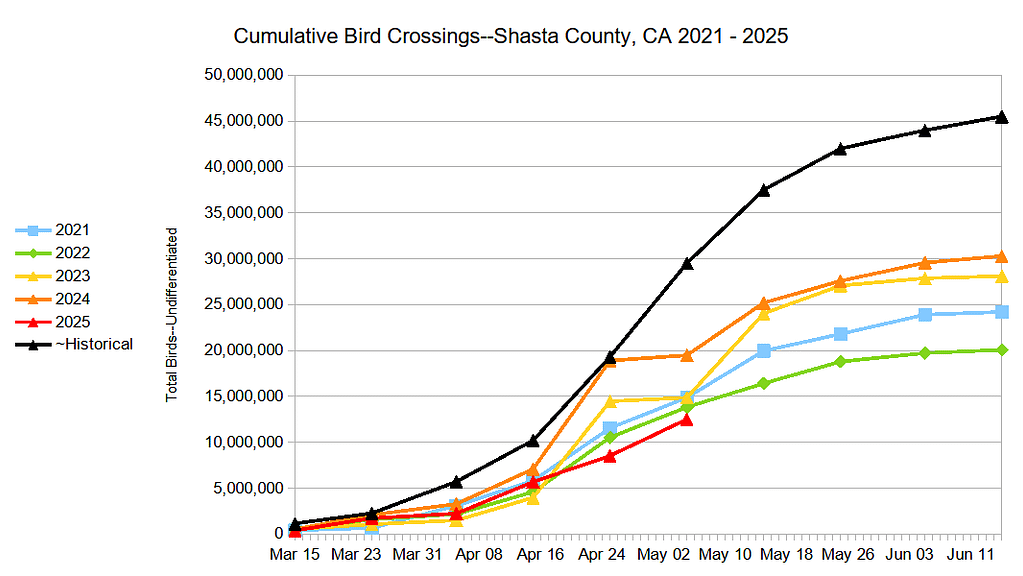
The current year is off to a very slow start, and like Kootenai County, 2024 was the best year of the four years with complete migration data. The worst years in Shasta County were 2022 and 2021, perhaps an effect of factors discussed below.
Casting a wider net, I researched fourteen birding hotspots, not necessarily representative of the entire country, with these cumulative results versus historical averages as of May 30 of each year:
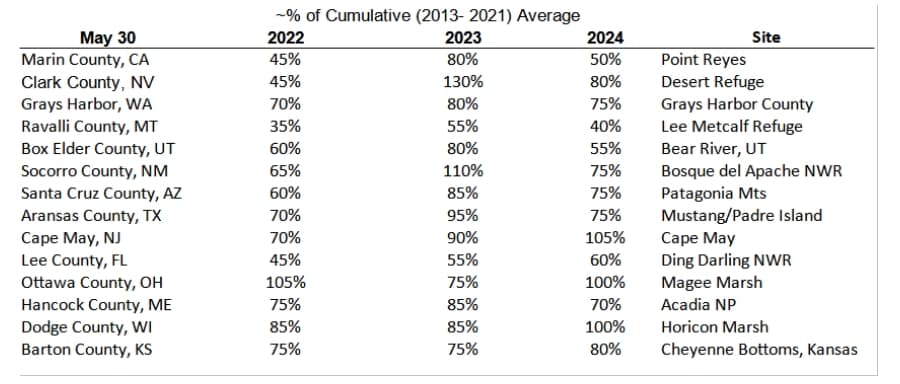
Sites in the southwestern United States have been subject, in many cases, to extreme drought. The first seven entries are western sites and the next seven are Midwest, East and South sites. Possible takeaways from the table are that, overall, the East and Midwest bird migrations are in somewhat better shape than those in the West, and that the counts in the majority of locations are down from historical levels.
I know that my little patch of the bird world is in real trouble. Gone are the pesky flock of pine siskins, the finch and cowbird feeder battles, robins all over the yard, owls hooting from different sectors in early March, and occasional flocks of evening grosbeaks. There are indications from the big data picture that it is not just a local problem. What do the experts tell us?
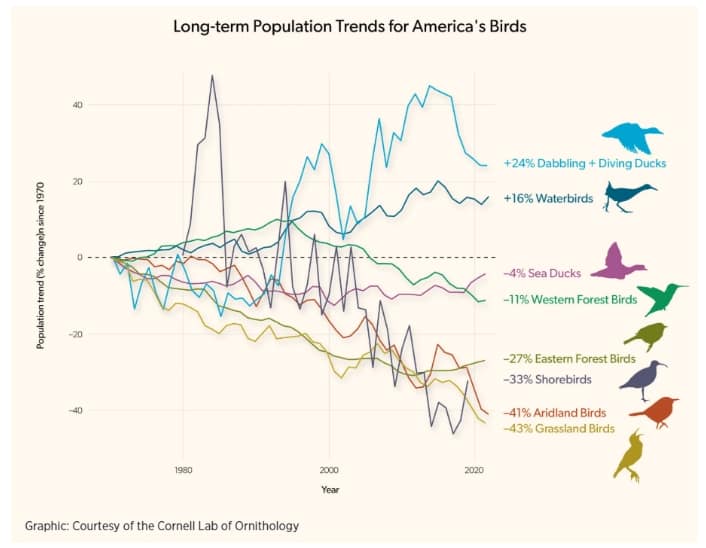
A modest search on the internet returns many references to a Cornell Lab of Ornithology 2019 study that concluded that we have lost 3 billion migratory birds since 1970 (see https://www.audubon.org/news/ the-southwest-facing-unprecedented-migratory-bird-die). The study also found that 389 species of birds are threatened with extinction. It’s an unfortunate fact that animal populations in decline tend to reach a “tipping point” and crash precipitously. There are few success stories in those cases where humans have attempted to bring a nearly extinct population back to a self-sustaining level.
A State of the Birds report for 2025 released by the U.S. Committee of the North American Bird Conservation Initiative (NABCI), a coalition of various birding organizations included this statement: “The rapid declines in birds signal the intensifying stressors that wildlife and people alike are experiencing around the world because of habitat loss, environmental degradation, and extreme weather events,” said Dr. Amanda Rodewald, Faculty Director of the Cornell Lab of Ornithology’s Center for Avian Population Studies. “When we see declines like those outlined in the report, we need to remember that if conditions are not healthy for birds, they’re unlikely to be healthy for us.” (https://abcbirds.org/news/ 2025-state-of-the-birds/). The report provides a visualization of the health of different bird groups and now identifies 229 species, a third of the total, that are in various stages of decline.
It’s interesting that none of the birding organizations like Audubon or American Bird Conservancy mention EMF or RFR (radio frequency radiation) as a possible cause of bird failure. They highlight categories like “environmental degradation” and list the following:
- Loss of habitat here and in Latin America
- Pesticides
- Cats
- Bird collisions with glass (no mentions of collisions with windmills)
- Plastics
- Wildfires
- Climate change (Huh?)
Certainly, the first couple of factors are huge. The last item is kind of ridiculous. The Audubon Society advocates for wind and solar power, but the 2025 NABCI report specifically mentions negative solar development impacts on certain arid land bird species. Its main focus on the web page seems to be to get you to sign up and donate. It reminds me of the NRA or AARP. There are plenty of published studies on the deleterious effects of electromagnetic fields and non-ionizing radiation on insects and birds. Windmills and solar panel farms create hazards for birds and create deserts for any life whatsoever. A drive south of Las Vegas on US95 to Parker, AZ will give you a glimpse of a solar farm desert. A drive on I-84 along the Columbia gorge will provide a display of hundreds of windmills, featuring toxic blades, tons of imported rare metals for the turbines, and surrounding areas exposed to deadly low-frequency ground energy.
Then, “Loss of habitat” and “pesticides”, very general terms, could be given more attention. The former can include both herbicide and pesticide ground and aerial spraying, atmospheric spraying (e.g., cloud seeding and/or geoengineering), urbanization, long-term drought, and a changed mix of crops over the decades, including introduction of herbicide substances in seeds. Some of these factors directly impact bird health, others also reduce the insect and plant food supply and its diversity. Focus and mitigating actions are possible for specific factors, whereas the avoidance of identifying these tends to ensure that nothing will be done about them.
I remember Spring mornings in the Wisconsin woods when the songs of the migrating birds were all around you like an urgent chorus. It may still be like that there, but it’s not so where I live. I see in recent internet posts reports of spectacular bird die-offs in specific locations; nothing about rapid general decline. We now have the Migration Dashboard with all of the RECENT historical data that shows that something has really gone wrong in most locations compared to even the 2013 -2021 period. To help me with my local problem, I compiled a list of some potential causal factors that show step, or rapid changes, in contrast to gradual phenomena like the increase in use of broadcast herbicides over time.
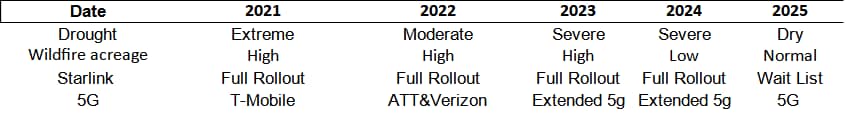
What’s changed since 2013-2021? I list factors that seem to be special events. We have had four years since 2021 of almost continuous drought, starting with the 50-100-yr drought of 2015 and continuing up to the present.
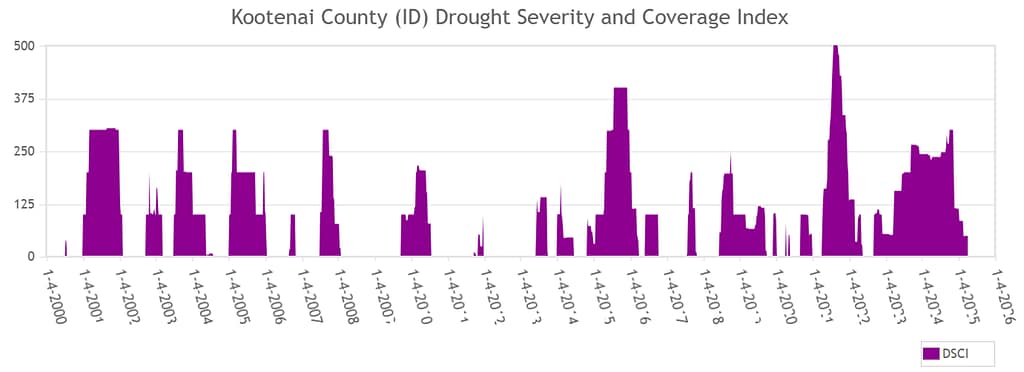
Source: https://droughtmonitor.unl.edu/DmData/TimeSeries.aspx
The Southwest part of the country from whence most of our small Idaho migratory bird population is sourced has also been in severe-to-exceptional drought for most of the period 2021-to-present. Certainly, that drought extends for some distance into Mexico.
Wildfire data for just the West is a little bit harder to recover, but assuming that the chart below mostly reflects the West, wildfires don’t seem to be especially anomalous at any point in this century.
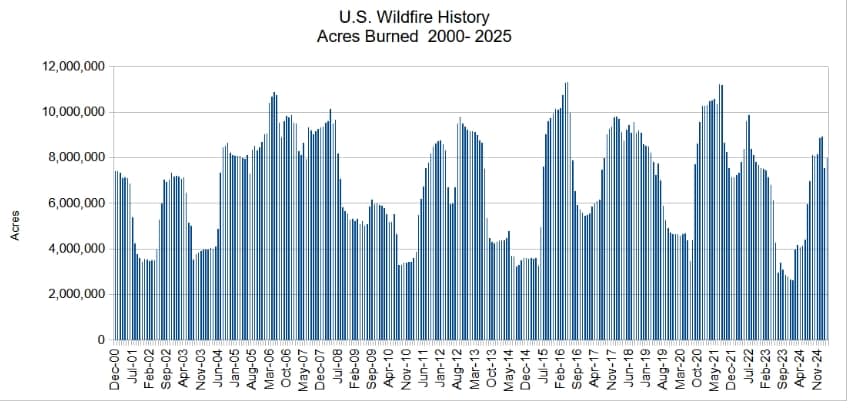
Data source: https://www.ncei.noaa.gov/access/monitoring/wildfires/12/0
To be sure, the period of late summer 2020 to early 2023 was pretty active with high-profile California fires, but there were periods of similar activity earlier in the century.
Which brings us to the essentially unregulated radiation sources, the wireless phone and internet providers, the low frequency energy-emitting windmills, satellites of the Department of Defense proxy controlled by an obnoxious South African billionaire, Starlink, and soon Bezos’s Kuiper satellite array. In a nutshell, the derelict FCC has allowed these entities to bathe us in non-ionizing radiation according to ridiculous-at-the-time standards promulgated in 1996. We all know that there has been a massive increase in wireless radiation, router and cell phone power and number of frequencies in use since the turn of the century, and especially since around 2010. There are inconvenient studies showing negative effects of these types of radiation on bugs, birds, animals and humans, including human fertility, but nothing is done. Now that the thousands of satellites are pumping signals to every formerly hidden nook and cranny in the northern hemisphere, data on the amount and types of radiation that are bestowed upon us by these orbiting death stars seems to be unobtainable. I sent a message to Environmental Health Trust asking if they have any data on Starlink and it has so far gone unanswered.
SpaceX launched its first batch of 60 Starlink satellites on May 23, 2019. Between February 2018 and May 2024, SpaceX successfully launched over 6,000 Starlink satellites into orbit, which includes prototypes and satellites that failed later, or were de-orbited before entering operational service(https://populartimelines.com/timeline/Starlink/full). Despite the massive Starlink satellites in orbit today, the company requires a total of 12,000 satellites to be fully operational by perhaps 2030. As of now, Starlink manufactures around 120 satellites a month (https://www.sciencetimes.com/articles /32690/20210806/spacex-starlink-ramping-up-rollout-service-beta-test-users.htm). Bezos’s Kuiper satellite array will start launches on April 9, 2025 for a total of 3,236 satellites by July 30, 2026.
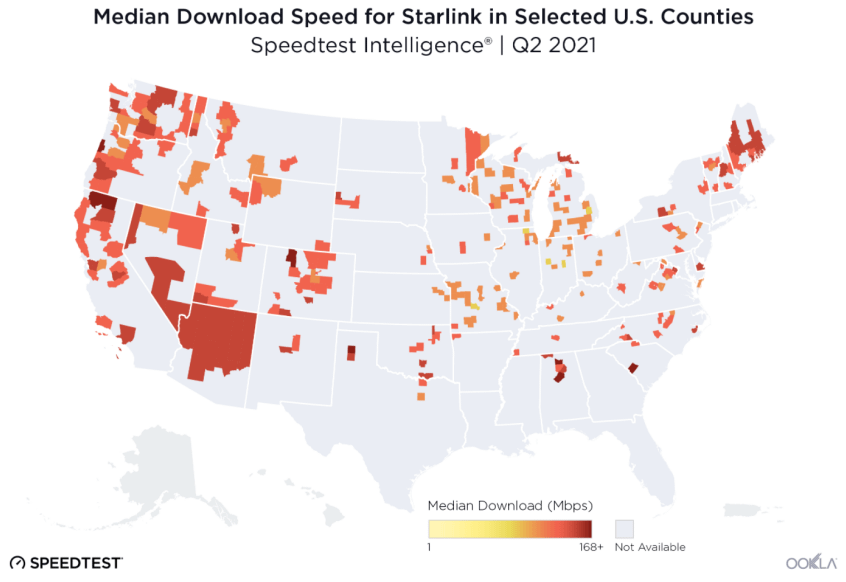
I t sure looks to me like my area of North Idaho is fully bombarded by Starlink’s benign radiation, as are the birds and creatures of the woods. And that map above was from four years ago. I wonder why we didn’t have many bees in the last couple of years? From the previous table, Starlink coverage nationally has been around since 2022 and is now over-subscribed in my area.
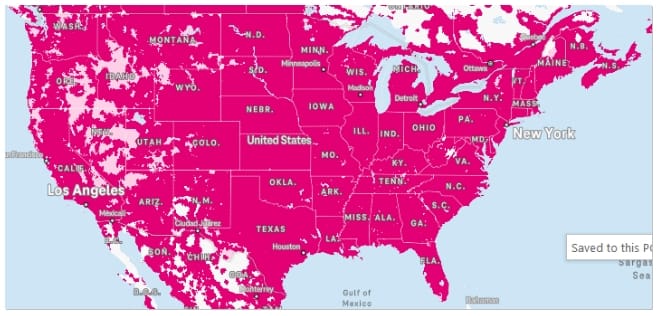
Let’s not forget 5G. Think you can get away from 5G, and for that matter, 3G and 4G which are very similar in characteristics? Below is T-Mobile’s current map of 5G coverage. 5G rolled out in 2021 and has now passed from “extended 5G coverage” to full coverage in 2025 in areas very close to my home.
In conclusion, of the possible special causal factors for bird decline, the evidence points away from wildfires and towards drought, leaving radiation from satellites and cell towers unproven but suspect. One can get a sense of the potential problem from this article posted on Environmental Health Trust’s website ( https://ehtrust.org/the-fcc-is-supposed-to-protect-the-environment-it-doesnt/) But, a reminder from the opening paragraph of this post is that the bird decline, for whatever reasons, is a warning to humans that something is not right with our stewardship of the planet we live on. If all but the most robust and human-compatible birds leave us, it can mean the insects and plants needed for the sustenance of the “canaries” are disappearing, too, and they make take our human population down with them.