At first glance, reporting of grade and tons from underground face sampling seems like a no-brainer application of simple arithmetic in EXCEL, right? Yup, no argument there…except, how come it is almost always done incorrectly due to faulty formulas, faulty assumptions, or both? Ok, we just take samples along a line, horizontal, vertical, or perpendicular to the trend or contact depending on the preference of the mine geologist and geometry of the mineralization. We then make a weighted average by length. Oh, and maybe double-weighted by density—oops, just left some of you in the dust there. Ok, good, thought about that. But what if the vein or lens sampled has a dip between 0 and 90 degrees? Is the result by this simple method correct? If you suspect that the length-density weighted average grade of the face is perhaps not the right answer you are, in most cases, correct. Every sample of a dipping vein actually represents a prism, or a wedge of material contained within the square or arched profile of the development heading. Footwall and hanging wall waste is often shaped as a wedge; ore, if centered in the drift is often a prism. If we consider the areas represented by these line samples, then only if the mineralized lens is perfectly vertical or horizontal will the result of area weighting be equal to length weighting in a routine face sample. Otherwise, systematic bias is generated by assigning the length and/or density weighted average of a face sample line as the face grade. This is illustrated in the example below:

|
Method |
Face Avg Au (ppm) |
Face Avg Ag (ppm) |
Net Face Value ($USD) |
|
Sampled Width |
|
Length+Density |
1.52 |
97.7 |
$68 |
|
3.75 |
|
Area +Density |
1.24 |
81.6 |
$52 |
|
3.75 |
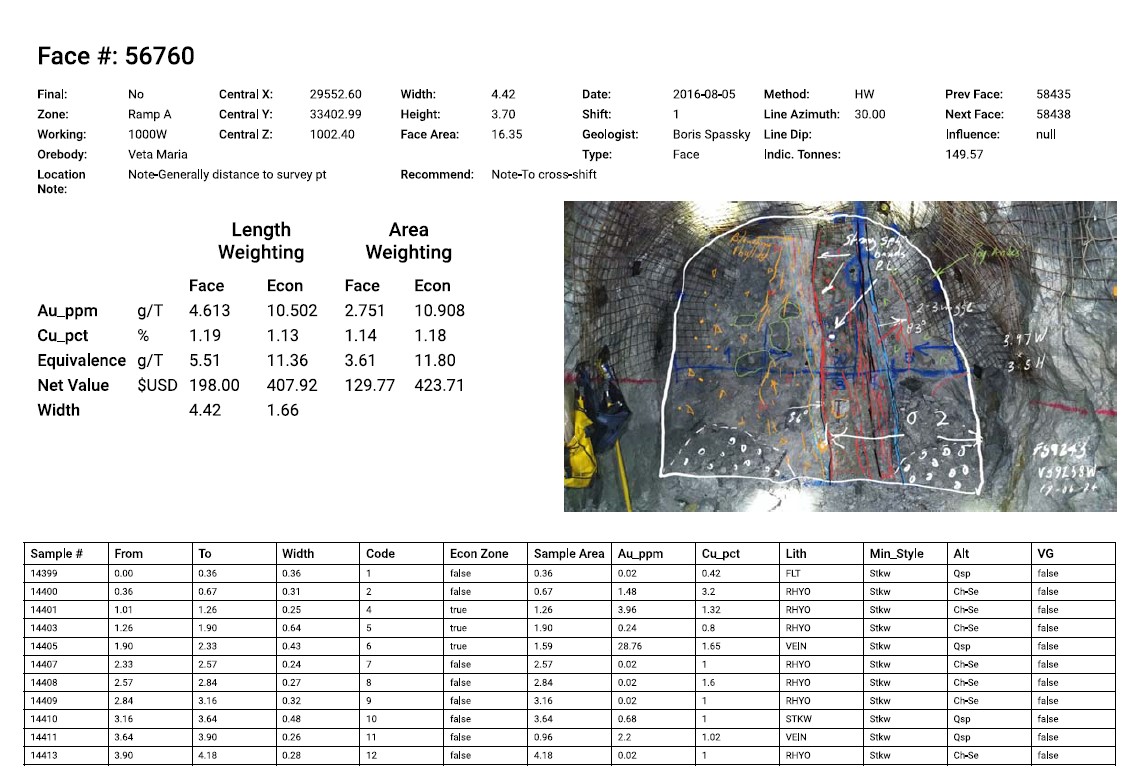
It is quite possible in many, but not all cases to determine the area represented by each sample taken at the face provided that the samples taken are delimited based on visually applied criteria such as mineralization, alteration, lithology, structure, or a a combination of these. What is required is that the limits that define the sample breaks are mapped on the face as polylines to at least relative scale. Thus, the geologist should take a photo with the sample lines and breaks visible. He/she should paint some marks or lines on the face to be able to trace the breaks across the face. A USD5$ app can be used to easily generate the relative areas from a photo or a scanned face sketch on a smartphone or tablet. By applying area weighting to face averages, where applicable, the results of reconciliation to the mill should improve.
The StopeCalcTM web app calculates and reports face averages using options for both length+density and area+density weighted averaging. The app requires input of face dimensions and face influence along strike, so that face grades are also weighting according to the stike influence that each face represents. All of the key information for each face is summarized in a Quick report pdf:
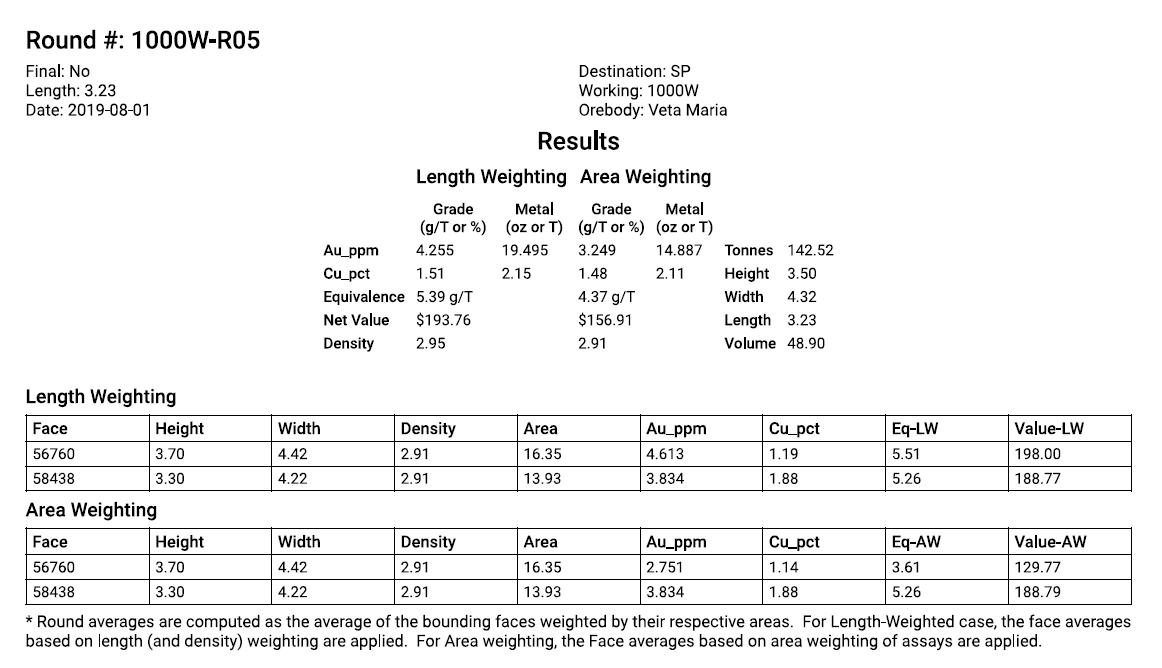
Development tons and grade are often reported by geologists based on face grades. As mine geologists we must be prepared for the question at the morning production meeting: “What’s the grade of the muck in 435 drift today? Ore or waste? High-grade or low-grade?” The geologist looks at the face grade and says: “It was low-grade, but you need to stockpile the muck until we map and get the grade on the current face.” This is one smart geo. A lot of them will look at yesterday’s face and send the ore to the stockpile or waste dump based on the previous face. The smart geo knows that we mine rounds, not faces. Two faces bound a round. We should use the average of the two bounding faces to determine the grade of the round. If there is any doubt about whether a round is high-grade stockpile material, low-grade stockpile material, or waste, then the round should be placed in a dedicated ore muck bay until the results from the current face are received.
The StopeCalcTM round manager will calculate the grade of the blasted round based on the bounding face information, weighted by the area of each face. Now, the geologist can go to tomorrow’s production meeting and instruct operations to move the stockpiled round from the day before to the correct destination, instead of using only the information from a single face. He can pass out copies of the Quick View report from the StopeCalcTM database (below), and even better, the other key production managers can have web access to the reports from their Reviewer-level licenses.
.The StopeCalcTM app gives the user flexible input to project parameters such as density calculation customized per sample or by ore or waste assigned default values, metals prices, recoveries and payables for mines that use equivalency cutoffs. The database accommodates up to two precious metals and five percentage-type metals (e.g., base metals):

Three levels of user permissions are set to ensure data integrity. Client databases are not shared with other clients; storage is on the cloud but the database can be exported to a local machine by the administrator. StopeCalcTM is a flexible and reasonably priced subscription-based service. Why not ask for a free 30-day demo and experience reliable estimates and reconciliation from your grade control data now? We even have a development framework to customize the app for Imperial system clients should one materialize. Yes, we are committed to support the Imperial measurement system because of its use by cutting edge mines in U.S., Myanmar and Liberia. Apologies for the oblique humor and sales pitch, but we have to ensure that we pay the web development costs. Happy grade control!