The mining industry has lost one of its best mining engineers with the death of James S Knowlson V this last January 2, 2022. Jim was the Chief Engineer at Anaconda’s Butte, Montana operations, starting there as an underground sampler in the late 60’s while he worked his way through Montana Tech. Jim brought a wealth of knowledge with him to other jobs from his experiences in Butte; from his work in the geology department he knew more about geology than most geologists. Jim’s passing has made me reflect on my own Anaconda days and how Jim carried the torch to many young engineers and geologists over the years.
In Part I, we had a look at the Anaconda technical control system for engineering and geology and how it was implemented at the Cannon Mine. Much has been made of the Anaconda mapping method in our industry. It is part of a comprehensive system of technical support that was first developed in the Butte, Montana mining camp. The mapping method was developed by David Brunton and Horace Winchell for Anaconda (Amalgamated) in the late 1890’s and carried on with success by Reno Sales during the “Wars of the Copper Kings” in the early 1900’s. It has been mistaken by many geologists as a paradigm for mine geology control. It is an important component of the system discussed in Part I. In various forms it was disseminated to other Anaconda mines that I personally know of; e.g., Yerington, and Park City. Experienced Anaconda production geologists that I worked with like W. J. Garmoe, Chief Geologist at Park City and Carr Fork, pretty much mapped with three colored pencils: 1) Black for contacts, joints, notes and to emphasize structure; 2) Blue for faults; and 3) Red for “mineral”. Bracketed side notes were placed outside the drift face, ribs or dig face. The geologist made his own accurate survey in a way that could be adjusted to final engineering survey later. The map product clearly displayed the location of lithology breaks, strength of mineralization and faulting, all without clutter. The system addressed the mapping of veins and faults perfectly, and could be applied to other types of deposits as well. That is the original Anaconda mapping method.
As a new breed of research-oriented geologists rose within the ranks in the 1960’s and 1970’s, the system was modified and expanded, formalized in a memo issued in 1966 by Anaconda’s J. P. Hunt (Diamond Drill Sections and Detailed Pit and Tunnel Mapping, 1966). Much more emphasis was placed on mineral species and alteration, requiring the mapper to carry a quiver of more than a dozen numbered color pencils to represent all of the different features, and a specially modified clipboard attachment to hold all of them. These modifications were an adaptation that followed the increased exploitation of porphyry and skarn deposits by bulk methods. Much was being learned about these systems and their genesis; a few companies like Anaconda even had research labs that were cooking up theoretical magmas in pressure bombs.
The memo in question comprised 12 pages of instructions, descriptions, drafted maps, lists of abbreviations and symbols, and the required color schemes for lithology, texture, alteration, structure, copper mineral ratios, and placement of notes. It was a cumbersome system that required much more time to implement and great skill to depict in a way that was presentable. The best practitioners were like 19th century portrait artists, capturing every detail. Some of the logs and maps reminded one of the pointillisme master Seurat’s A Sunday on La Grande Jatte.

Done well, form would emerge from the mass of lines, dots and dashes on the maps, reproducing the textures and mineral distribution of the rock; something like a modern hyperspectral scan.
I was a latecomer to Anaconda with a lowly Master’s Degree. In my first assignment, I was trained by the ‘Berkeley boys’ in the enhanced Anaconda system. We logged miles of porphyry and skarn core, and mapped benches in the pits. Not being an artist, it took me a long time to approach any sort of mastery. I would expend a lot of effort afterwards to extract the information I needed to transfer my notes to compilation maps and sections.
All of the projects got this treatment which was feasible at the languid pace of exploration that characterized the aging U.S.-based mining companies in the 1970’s. Apart from Pumpkin Hollow, an aeromag discovery, the conceptual successes made by Anaconda’s western office were actually based on structural interpretations, not petrology. From the operations perspective, the geologists were of little daily relevance to the Yerington mine and the geologists’ focus was finding a new one. The mining proceeded on blast hole information and there was no formal grade control program of which I am aware. Yerington was a good mine and didn’t need much tending once the footprint was established. Sporadic mapping was done and occasionally there might be a consultation on a specific operational issue.
Fortunately, I made a move to the Carr Fork Mine at the pre-production stage where W.J. (Jim) Garmoe was the Chief Geologist. In a couple of sessions underground with Jim, I learned the old Anaconda system and why it was so practical for operations geology. The main idea is to graphically emphasize, or weight structure and mineralization so that you can see where the ore is on your map from across the width of a big conference table. We mapped structure first with our blue pencil, or with a thin black pencil line based on a quick assessment made by stepping along the length of the tape hung on the wall or between survey spads in the back. A thin blue line denoted a weak fault; a thick line denoted a strong one. We then went over the stronger structures with a sharp black pencil to make them stand out from the rest. With this simple system, one could see where the mapper thought the most movement occurred; e.g., on the footwall slip, or on Fault A instead of minor Fault B. This was done with mineralization, too. First the red dots, dashes or lines for veins, then black pencil for emphasis, as warranted. Blue, black, red. Where’s the main fault on the map? Look for a fat blue line. Where’s the mineral? Look for the strong red.
The field sheets shown here are the best examples of this system that I can provide. The first is a bit of quick mapping in a 400 year-old Mexican mine made by me long after my best days underground were behind me.

The map is not drafted, it’s just as it was when I came out of the mine. It’s easy to see the trace of the main structure and the mineralization. There are plenty of structural measurements without a lot of clutter.
The second example is taken from a folio of field sheets for five mining levels of the Oro Cruz Mine that I made 25 years ago and still have in my files. For some reason I didn’t put them in the project file drawer at work. That’s a good thing because the mine, exploiting an odd thrust-hosted deposit, is now closed, and in the U.S. data from old mines is regularly landfilled. The particular example below shows a rib sketch of the thrust zone with a bit of extra orange for intrusives and for quartz to distinguish it from pyrite mineralization. It was hot in that mine and you had to keep from wetting the paper.
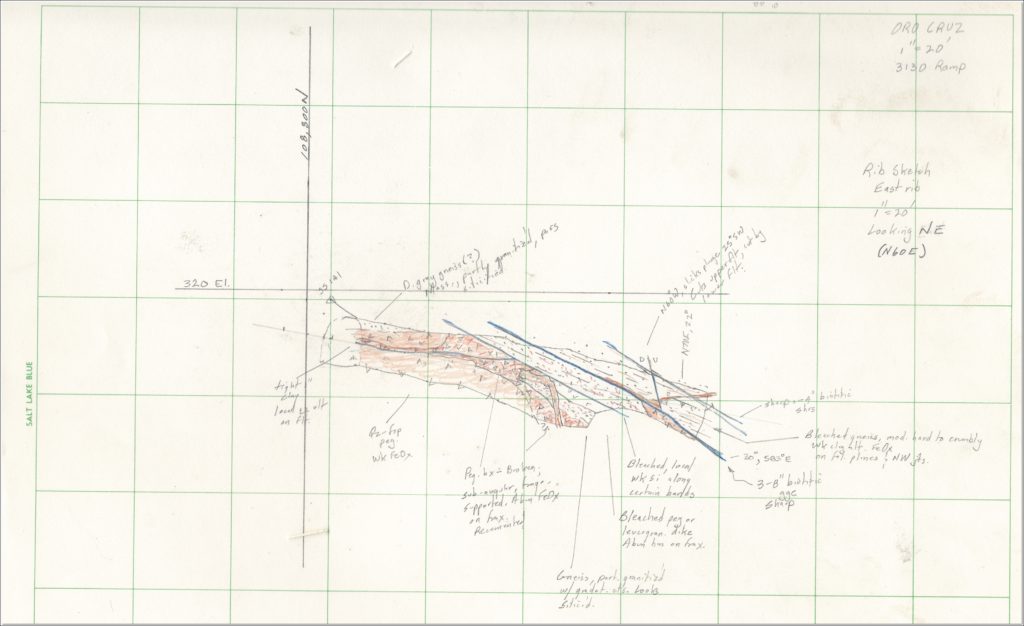
It’s plain to see the mineralized zone from, more than anything, the faults.
The final example is a black-and-white copy of a sheet from mapping of a haulage level of the Dean Mine, NV. Salt Lake Blue was the paper of choice in the day, a high-rag content, quality paper somewhat resistant to water. The originals are probably in some landfill library.

Despite the lack of color, it isn’t too hard to see where the structure and mineral occurs and how it pinches and swells. The drift mapping in these examples was done at chest level. Note that each session’s advance and date is shown in the margins. The scale is shown, and the author.
Geologists trained at Butte learned a standard lettering style that was very elegant. I didn’t have the benefit of that training and Garmoe didn’t think it was especially important. I would never have endured the arduous apprenticeship of Butte and the rigid way of thinking it seemed to produce in some of the ‘survivors’. But I could recognize the work of any Butte-trained geologist (e.g., Dick Miller, Bill Payne) or engineer like Jim Knowlson. It was marvelous. Unfortunately, I have to mostly use the past tense these days. These field notes were transferred to posting sheets which in turn were used as the basis of interpretative maps.
Returning to the Carr Fork story, Jim Garmoe, like some others in Anaconda, had a keen eye for his objective—mine ore, avoid waste. The amount of biotite or sericite didn’t much matter. I blended that basic method with the more elegant, new Anaconda system ingrained in me at Yerington, but I made sure I could see the faults and the copper ore on my Carr Fork maps. And what, in the end, was critical to being able to mine the Carr Fork skarns? I can tell you from the hard lessons of my three years in that mine until it closed prematurely that closure wasn’t due to the amount or type of different minerals shown by colored pencils. Carr Fork failed because of a set of abundant, steep northeast faults and dikes which chopped up that orebody like celery in a vegan restaurant, plus some terrific construction and engineering gaffes. Those faults, well-known to geologists in the historical mines above the new orebody were not taken into account when the new Anaconda crop drilled a literal handful of vertical holes into the skarns and published a reserve based on those amounting to tens of millions of tons of continuous skarn ore. The logs made of the drill holes were very pretty full-dress Anaconda mapping system style. The headquarters view of the extension of skarn mineralization in the Bingham Syncline to 1500 m below the surface was of a continuous folded sheet—no matter that underground mining in the 1930’s just above the new reserve failed due to complex structure and a barren dike that followed the ore lenses. A 90-year old geologist from that earlier era told me all about their woes with that deposit at his home in Salt Lake City in 1982. The new Carr Fork mine was going to be the flagship of the resuscitated Anaconda (and even be the first metric mine in the U.S.!). Those Anaconda exploration geologists were seldom seen as the production date approached, and then never seen again once we were in production, having gone on to fame and fortune at academic institutions while we stayed to try to make something of the mess.
I remember Garmoe and I standing over a longitudinal section made from level maps marveling over how that 30m-thick “orebody” really comprised a couple of variable-thickness lenses, one in the footwall and one in the hanging wall of the Yampa Limestone, separated by internal waste. The limestone contacts with barren quartzites had moved like piano keys in a jazz bar, one block up, another down. Drawpoints designed from the reserves were found to be in the middle of the ore, or 5 m above, or below ore, seldom in the right spot. The displacements and incorrect characterizations of the orebody stratigraphy were so significant that more dense information from later definition drilling could not mitigate the flaws in the original mine design. All that mattered for that mine was the dike and the network of weighted blue lines (northeast faults) and what they did to the black lines (contacts) and red zones (ore) on the map. Not the mineral zoning, the textures or metal ratios. Alteration and other overlays were not useful to guide production.
But for those who still wish to know more about the enhanced (i.e., academic) version of the Anaconda system, there’s a good unpublished summary of the method authored by M. Einaudi in 1997 and available with a web search. One of the application examples given in that booklet is the Pancho porphyry gold (Cu) deposit in the Maricunga belt, illustrating results of field work by another able geologist. Figure 7 in that booklet shows mapping of quartz veinlets that purportedly define the orebody. In detail, they don’t. The only predictor of gold in the Maricunga porphyries is gold itself. No team of geologists working in that entire Belt has been able to apply Anaconda mapping methods to metal grades in a manner useful for either gold or copper resource estimation, or production. I’ve had a go at estimating resources and monitoring grade control on fully seven porphyry gold deposits in the Maricunga, thus I’m not speculating about ore controls. And, while all of the detail is interesting and advisable at the early exploration stage when you have to milk information from every drill hole, it is only tangentially useful for exploration of concealed orebodies because; e.g., the quartz veins and potassic alteration associated with the metals are proximal indicators.
In summary, it is arguably good to know as much as possible about a district and its orebodies, and to give bright, curious scientists an opportunity to have a detailed look at anything and everything. The idea in logging and mapping is to observe and record the facts, and that is fundamental to the Anaconda mapping system. Referring only to the group, and not individuals, production geologists tend to have tunnel vision. This isn’t good always good because data should also be collected in order to test hypotheses and solve problems; tunnel vision in all aspects of a job is a dead-end. Thus, there is a compromise, or a dichotomy in operations. But in a production setting you can’t have the whole team running around mapping biotite and quartz vein densities, spending all day in a single heading or the core shack while there are many other things that need doing. The original Anaconda mapping system, with local minor variation, is a practical shorthand tool for following and predicting ore lenses controlled by lithology, faulting and folding. We can put our large quiver of colored pencils and alteration overlays away for all but special studies, or for consultants. Daily, we can make our necessary notes working with the lean, focused and time-tested system developed 125 years ago, and get on with the many other tasks involved in providing geology inputs to resource estimates and mine operations.
Well, I will do so, at least. Actually, I prefer my tablet for mapping these days—rather than draw geology, I can trace on top of the imaged geology and make notes. I can still annotate and trace over the image with black, blue and red virtual pencils. Anaconda method v. 2022, low-emissions and sustainable (no paper). 😝
Footnote
In the post Changing of the Guard (2022, Parts 1 and 2) I discussed the Anaconda mapping system and the contributions made by various practitioners, including my past supervisors, Jim Knowlson and Walter J (Jim) Garmoe, on the occasion of the death of the former gentleman. Regrettably, we have the news of the death of Jim Garmoe on August 9th, 2024.
Jim was the consummate gentleman and an inspiration to many aspiring geologists and support staff, including me. He was a first-rate mining geologist and a great geology mapper. Our group at the Carr Fork Mine where he was the Chief Geologist was diverse and the mine was challenging to say the least, but Jim kept high standards and we did what we could as a team to try to make that mine a go. And we had a lot of fun doing our work.
When I went to work for Jim, my career was at a low point and I was considering throwing in the towel. This was my last stop. In my first week at the mine, Jim guided me underground and we had a mapping session in an active heading. He explained the mapping procedure in clear and simple terms, showing me what was important to note, and how to record the data efficiently. That was a revelation to me, having spent the previous 3 years in a sink-or-swim environment with little guidance. That was all I needed to get started and things only improved for me over the course of the next years until the mine closed. We ended up collaborating on a research project and publication of a paper on the mine geology.
The mine started developing stopes on the 1200 m level. I will digress to mention that Carr Fork was to be the first big mine on the metric system. President Jimmy Carter, a “nukear” engineer, was making a push to make America metric, and, like today’s mining companies wanting to go green to show how swell they are, Anaconda was going to get on board. Of course, the diamond drill rods were 5 ft long and the assays for all the exploration drill holes were 5 ft long so we converted them to meters, by hand calculator. Each assay interval was 1.52 m, except every third one had to 1.53 m to avoid cumulative precision error. Then, we were kind of new to the whole thing so we converted troy ounces of gold and silver per short ton values obtained during the project exploration stage to troy ounces per metric tonne. I mean, what is this grams thing? Maybe you can imagine the confusion all this units conversion stuff caused our technical staff. Any conversion screw-up and we had a 10% error, just like that! I think the engineers had it worse. Two sets of scales, one for old drawings, one for new ones. I don’t think I ever recovered. Thankfully, we didn’t have to reset our thermometers to Celsius or I probably wouldn’t be able to write this article from the lunatic asylum where I had been committed.
Anyhow, we were way below the surface burrowing toward high-grade hole #50 which the crack team of PhDs in the exploration team had bestowed upon us. This hole had a 30 m thick skarn intercept of +3% Cu. In the late 1970’s, long before NI 43-101 and when geostatistics was a strange new practice, the guys estimated something like 10 million tons of this grade by drawing a polygon around drill hole #50, and the not-so-bright management of latter-day Anaconda took this to the bank. It was a big chunk of reserves and it was the priority for development and extraction in the new mine. Jim brought me underground in my first week on the job there and we mapped a drift that cut the trace of the hole. You could see its round cross-section in the drift back and where it exited in the rib. The rock was loaded with chalcopyrite around the hole. Jim showed me how the super high-grade pinched on either side of it within a few dozens of feet, er, meters. He didn’t elaborate a lot about it, that wasn’t his style. He showed you the facts and gave you a glance to see if you grasped the significance of the data. A few years later, he published a short paper about drill hole #50. The gist of it was that subsequent to drilling that hole in the exploration phase of the project, we drilled 300+ holes before we got another copper intercept anywhere near that good. The negative impact to our ore reserves was large.
In another moment, we had a discussion about all of the faults we were seeing cutting the quartzites that sandwiched the skarn. The faults offset the skarn. The skarn was like a set of piano keys being played, some up, some down. You don’t see that when you are an exploration geologist making a great discovery and connecting all the good intercepts that are seen in wide-spaced drill holes with straight lines. Especially when you ignore the historical mapping in the old mine hundreds of feet, er, meters above you from over 30 years ago (the Apex Mine) which showed this very thing. There it wasn’t as consequential because the orebody comprised skarn beds standing vertical. It isn’t so good when the ore rolls flat around the nose of a syncline and those fault offsets result in a mine plan that is based on a continuous tabular orebody with a gentle dip but is actually chopped like a steak hibachi-style. The effect of these “minor” offsets was that our drawpoints were driven substantially below the orebody, or in the middle of it, almost never at the right elevation. What a mess. We were in trouble, but Jim held our team together and we focused on getting more new information, recording the facts and trying to find more places to mine so that we could fill the mill someday.
Recognizing the need for more information, Anaconda had 3 drill rigs running underground. We were four mine geologists plus Jim. One of the four was generally on temporary loan from various exploration groups around North America to get some mine experience, so the other three of us were each assigned one of the rigs. By morning, we were in the mine. Bill Feirn (York-Feirn) and I were go-getters. Sometimes we would jog one mile along the track drift to our working areas. The geos would catch the noon cage and spend lunch in the core shed being entertained by the stories, humor, and wisdom of John Baker, the chief technician, and logging core for the next hour or two. After logging, we hurried back to the office up the hill to post our morning mapping on mylar plans and our drill logs on sections with pencil or rapidograph pens. I don’t think I can remember how to do all that now, and it’s time for me to toss my pens which are pretty clogged up by now.
Anyway, we had a senior geologist (i.e., old) from Butte who wasn’t as efficient. He fell behind in the logging part and this went on until there was a great stack of core waiting for him to log and there were complaints. One of my memories is of Jim Garmoe calling a meeting in which he divided all the unlogged core amongst the laggard and we three other geologists. Oh, my, did we complain! How unfair, blah-blah. But to Jim’s credit, that’s what he had to do. You can’t just fire someone for something like that, and that doesn’t get the core logged. We had to get the core logged. What else could he do? Anyway, we grumbled, muttered, and complained but we got the core logged after all, and anyway, it didn’t really matter because the mine ended up closing down for reasons other than a core backlog. When you have a high-cost mine and a recession the magnitude of the one in 1981-1982 there isn’t a lot of upside and not much point in speculating how the mine could have succeeded. The good news is that Jim got some consulting work for the company with more staying power that could really use his knowledge of the varied deposits in the Carr Fork area of the Bingham District. And for Kennecott (now part of Rio Tinto), the good news for it is that when Anaconda finally folded, that is, when its corrupt and incompetent owner Atlantic Richfield, the buyer of Anaconda in 1977, threw in the towel on hard-rock mining acquisition in 1985, Carr Fork fell into stronger hands.
It is said that Kennecott and Anaconda reps showed up at a tax auction in Tooele, UT in the late 1940s for the defunct property of the Apex Mining Company which defined the west wall of the Bingham pit, owned and operated by Kennecott. The Anaconda rep out-bid the Kennecott rep who had been given a ceiling. For the next 35 years, Bingham operations were hamstrung by the huge Anaconda salient into the Bingham pit. But Atlantic Richfield practically gave away its property interest in, or around, 1987, selling cheap to Kennecott. For the next several years afterwards, Kennecott enjoyed bumper production from the relatively rich skarn ore exposed in the salient and overlying the Carr Fork mine. Almost 40 years later, that company is still talking about mining those skarn orebodies underground, the latest efforts an appropriation of $108M in 2021 for a feasibility study and a 2023 decision to invest $498M to mine around down there and try to upgrade the mineral resources from Inferred resource to a higher category. With Jim Garmoe’s passing, I hope they took good notes from conversations with him. At least Kennecott seems to know what rock formation hosts the orebodies. Anaconda’s exploration group got that mixed up, and although I attempted to rectify the confusion in my 1982 Economic Geology paper, the topic was ignored as everyone involved in the development of the Carr Fork Mine suddenly forgot that it ever existed.
Jim gave me a great honor when we were deepening the Exhaust shaft on the west side of the Bingham pit. I was his alternate on call, so we shared the responsibility for mapping the shaft as it progressed downwards. I would get called in the middle of the night. This entailed driving from my Salt Lake City home 30 miles to Tooele and up the mine road, changing into my diggers, brassing in, walking a mile along the Apex Tunnel, daylighting in the pit, and then descending in a sinking bucket to the bottom. There may have been Tommyknockers in the Apex for all I knew. I would walk rapidly through the dripping, iron-stained tunnel at 2:00 am imagining the noise and hustle and bustle of decades past. Then you would emerge on the west wall of the Bingham pit in the starlight.
I will never forget the first time in the hot, wet hell of the bottom of the shaft. Jim showed me how to map on waterproof mylar, printed with a pre-drawn circumference representing the walls, with a single black pencil, using some now-forgotten reference point. You didn’t pull out your compass there except for a dip reading. You did your work quickly there and added any color the next morning in the office. On subsequent visits, I went in with the shift boss and kept my back to his. He was directing the hissing Cryderman mucking machines with his mine light, standing on the broken muck. The buckets descended and swung in fits and starts amidst the loud hissing of compressed air and you had to be nimble to keep from getting in their way. The only safe place was where the shifter was standing and you had to have that contact so you could concentrate on collecting the data you needed for the shaft cross-section. I only remember one of the guys, a stocky Finn, Eric. After a while I gained confidence in that environment of steam and water and noise, knowing that the shifter would not let me get injured. Still, shaft sinking is one of the riskier jobs that a mine crew undertakes.
One of the things about Jim that I remember is his patience and absolute focus on the task at hand. Whether in private conversation or a staff meeting, he made his points briefly and deflected any personal or irrelevant comments. Once business was done, he would share something personal or off-topic, but there was no place for that until the necessary discussions were completed. Anaconda was a very traditional, hierarchical organization. It was a bit exasperating at times because everyone was on a need-to-know basis. At least with Jim, we knew he had a plan and that he had your back. He didn’t show up to work in a white shirt and tie like the General Manager. He typically wore a khaki work shirt and was as likely to head down the shaft first thing in the morning to map or check headings if he didn’t have administrative work to attend to. I think maybe he saw work a bit differently than the rest of us. He had a family and enjoyed his time with his wife Susan, daughter Terri, his profoundly disabled son Jimmy, and the horses. His job had its place, and one of the things he took very seriously was to train his people to be better, and to eventually succeed him. That is a successful management style that is rare enough in any field of work. Well, deep enough, Jim! And thank you.